

Stock price behavior felt a little crazy in March, sort of like the madness of a recent college basketball tournament, as the S&P 500 index declined in price by roughly 5.8% for the month and the tech laden Nasdaq composite index price was off roughly 8.2%.1 It got even crazier in early April following the President Donald Trump administration’s self-proclaimed “tariff liberation day” on April 2 when Trump announced historic tariff levies on various countries’ exports throughout the globe that were far larger than expected.
Following that news and revelation of subsequent retaliation threats issued by U.S. trading partners in the following days, the S&P 500 fell sharply. The S&P 500 was off roughly 14% in price on a year-to-date (YTD) basis through April 4 and has declined over 17% from its Feb. 19 high. Figures for the Nasdaq 100 index are -17% and -22% respectively over the same time frames.2
Unlike that basketball tournament, in which all the giant, powerhouse basketball programs once again dominated the competition, the mega-cap Mag 7 stocks on the other hand, that include such poster child, behemoth names as Nvidia, are the big relative losers so far this year having fallen by more than 23% in price on average as a group through early April.3 It’s the “Cinderella” stocks or the “other 493” that are leading in 2025, i.e., going down considerably less. U.S. growth stocks in general, after outperforming by historic levels these past two years, are taking a back seat to U.S. value stocks that are housed in the more defensive, mundane sectors such as Utilities, Energy, Financials and Healthcare. Losses in these sectors remain at modest single digit levels.
To add to the many examples of this rotational or topsy-turvy nature of equity market price performance so far this year, we should note that U.S. stocks that have dominated global markets for more than a decade are handsomely lagging international stock markets. Specifically, developed-country international stocks, which populate the MSCI EAFE index, have held up much better, returning 1% in dollar denominated price returns through April 4 of 2025 versus the YTD price return of roughly -14% in the S&P 500. International Emerging Market stocks, which constitute the MSCI Emerging Market index, have also shown resilience and are up 1% in dollar denominated price returns as of the close on April 4.4
The YTD Pullback Isn’t Surprising or Unusual
While this rocky start seems to have caught more than a few off guard, quite frankly, we had not been surprised by what we had seen prior to the “tariff liberation day” announcements. As you know, we introduced our investment theme for 2025 of Clear Air Turbulence in our January Crystal Ball presentation. This apt phrase captures our cautions to clients to brace for rather significant temporary pullbacks of 10-15% throughout the year before reaching our projected base case S&P 500 price level of 6600 at year end or soon thereafter, which would represent a 12% price gain from the S&P 500 closing price on Dec. 31, 2024, should that occur. We expected the first half of this year to be quite choppy before improving in the second half. This has been a relatively contrarian message as many firms rapidly turned bullish following the presidential election last November, believing that headlines about tax cuts and deregulation would drive multiple expansion and handsome returns early in 2025 and that stocks would be off to the races. We were more skeptical.
With price to earnings (P/E) levels at roughly 21.6 times forward earnings back then, we simply felt that news flow out of Washington that wasn’t exactly as hoped for, or that an economic or earnings number that wasn’t perfect, could cause air pockets and drawdowns periodically early this year.5 At such valuation levels, there isn’t much cushion for any disappointment in the headlines or in the monthly data. Further, it is important to note that pullbacks similar to the one we are currently witnessing are quite normal. The chart below shows the many years in which steep intra-year temporary corrections still end with handsome calendar-year results. Check out 2020 as a great example: a 34% pandemic induced pullback over a four-week period followed by outstanding recovery and a 16% full calendar year price gain.

Source: Data sourced from Factset as of 12/31/24. Returns are price returns. The S&P 500 index is unmanaged and cannot be directly invested into. Past performance does not guarantee future results. Investing involves risk and the potential to lose principal.
Real Surprise is Size of the Tariffs
Unfortunately, our instincts and research efforts have been more than affirmed via the heightened volatility and poor price performance early in the year. The chop and corrective price action in the first quarter through March 31 seems to have been largely inspired by the voluminous and ever-changing news flow out of Washington on topics ranging from tariffs to layoffs of federal workers to foreign policy initiatives; these have all raised consumer, business and investor uncertainty. This is not a political statement. This is simply reflected in the current survey data—consumer confidence is significantly down as is small business optimism. This has caused investors to be more risk-focused this year and has led to a modest contraction in the P/E ratio, which makes sense.
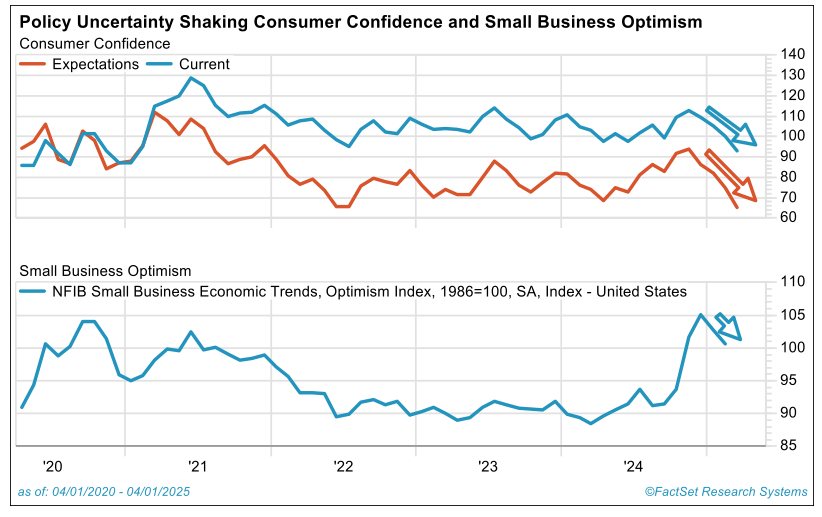
Source: FactSet
What really brought things to a head and elevated investor angst recently was the size of the announced tariffs on April 2. Specifically:
- They are BIG, but more importantly, bigger than expected. How big? The baseline and reciprocal tariffs announced on April 2 equate to roughly $500 billion in incremental tariff revenue, according to top research firm Strategas’ initial estimates, which is being levied on foreign trading partners by the Trump administration. That is in addition to the existing $150 billion in tariff revenue that is going to be generated by existing tariff levies announced earlier in February/March. So, this brings the total to $650 billion in new tariffs.6 To put this in perspective, total revenue raised by U.S. corporate taxes totals $530 billion, annually. 7 That’s right: this is larger than U.S. corporate tax revenue. It is historic. This takes the average tariff rate that the U.S. assesses on imports from all countries up from the current 2% level to roughly 20%. This is double the 10% peak level economists expected and that they had been modeling. It takes us back toward that path of the McKinley tariffs of 30% in 1890 that failed and the Smoot Hawley tariffs of 1930.
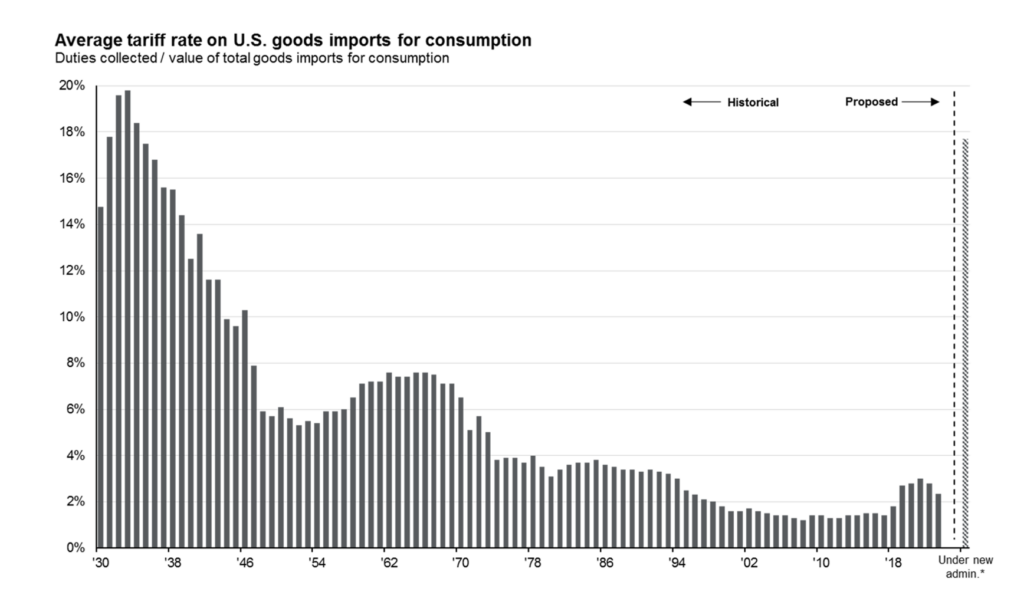
Source: J.P. Morgan Guide to the Markets 12/31/2024
- Given the magnitude of these tariffs, it appears as though Washington D.C. is more serious about their permanence than expected earlier and perhaps more focused on generating revenue for the rest of the Trump Agenda (particularly paying for tax cuts) rather than on posturing to influence trade flows; this is a surprise to folks. That said, we shall see. The jury is still out.
These announcements have caused a plethora of Wall Street strategists to raise their probability of recession and to publish downward revisions to their earlier, rather bullish S&P 500 price-level forecasts. In terms of investor reaction, the S&P 500 is off 9.6% in just the first few days of April, alone.8
Our Take?
The likely economic intermediate impact of the tariffs and this temporary dent in confidence is to slow economic growth and cause inflation to be moderately higher than earlier projected. Expect forecasts for real GDP growth and earnings to be revised downward. We have taken odds of recession up to the 40% level, but we still believe it is likely that the U.S. economy will post positive growth in 2025. That said, slower economic and earnings growth for 2025 than we anticipated and a higher price-level outlook likely limits the upside versus our prior expectations. The S&P 500 could still achieve our prior 6600 base case level over the next 12 months, but the odds of that have diminished. That said, there are paths to that outcome. For that to happen we believe one (or a combination) of the following must occur:
- The Trump administration could complete successful trade negotiations in the near term with our partners and help de-escalate the retaliation rhetoric. Discussions seem to be underway per current news flow.
- Congress might pass a robust tax cut package to offset the restrictive nature of the tariff levies. The $650 billion in projective tariff revenues could more than pay for these tax cuts.
- The Federal Reserve could pivot aggressively and become more engaged in cutting the Fed Funds rate to drive rates lower and support consumer spending and credit.
Most important, we want to help clients avoid taking premature action and suffering from whiplash. It was critical to prevent this in 2020 as the market quickly recovered from its sharp Spring swoon to end up posting positive returns for the calendar year. Already, there has been a whirlwind of emotion and trading activity with the S&P 500 swinging more than +/- 4% throughout the day on April 7. 9
While we think volatility will continue for some time and we believe any gains are likely to be more modest through the balance of the year, this upside case outlined above is clearly not off the table. The actual fundamental data in the economy is still solid at this moment. The payroll report for March that was just released was solid with 228,000 new jobs created, so consumer and investor confidence could return quite quickly should any of the events above be achieved.10 Given the still favorable fundamentals, selling below normal equity allocation levels isn’t warranted. So, clearly this doesn’t lead us to believe this current swoon in confidence is permanent.
In 2016, the Trump administration led with “sugar and honey-oriented” growth initiatives (e.g. tax cuts) that excited investors; only subsequently did they introduce the more “spinach” variety policy initiatives such as tariffs. In 2025, the Trump administration has led with the spinach and will try to follow-up with the growth initiatives later in 2025 that may entice investors and shift mood.
Ironically, one of the things we really like is the current extreme level in bearish investor sentiment. Investors haven’t been this bearish since the trough of the market in October 2022. The market tends to do quite well when investor sentiment gets this negative. This is a contrarian positive! At this point, we are looking for signs of bottoming and we see them developing with likely downside to the 4500 to 4800 level. It’s probably a bit early to buy on the dips except for the more aggressive investor.
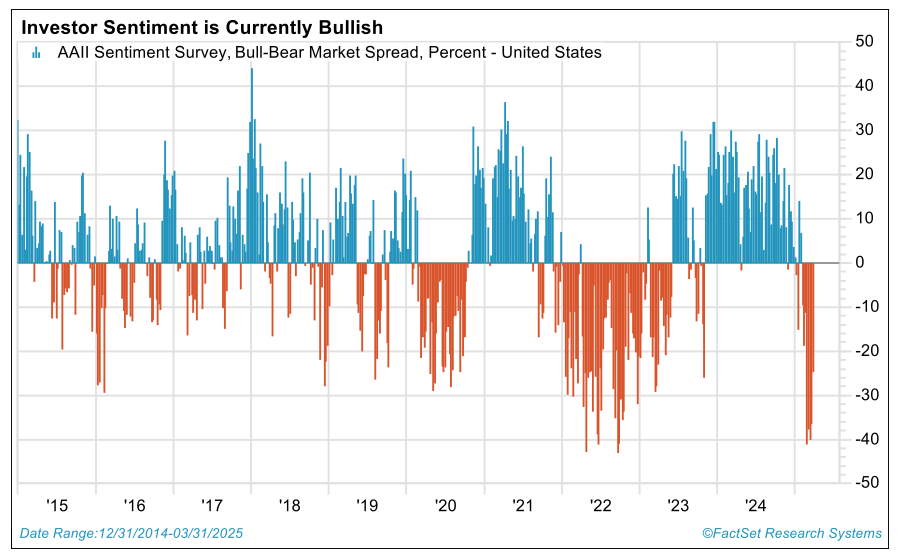
Source: FactSet
How to Position Portfolios?
So, what are we doing to navigate through this period of clear air turbulence and what are recommending to clients? Below are some thoughts in critical categories:
- Equity Allocation—Hold Your Ground! This doesn’t mean do nothing. Hopefully clients have listened to our suggestions to rebalance back to their normal long-term equity allocation level if the 60% cumulative advance in the S&P 500 over the last two years took them to well above normal. Regardless as to whether you did or did not rebalance and trim back as suggested, if the 17% peak to trough 2025 YTD pullback is causing you to not sleep at night, then the normal long-term stock target you have established is probably too high and should be set lower on a more permanent basis. Talk to your wealth advisor.
- Be Aware of Portfolio Imbalances: The charts below show the extreme outperformance of the Mag 7 versus the “other 493” stocks in the S&P 500 over the last several years and the extreme outperformance of domestic versus international stocks. This may have led to major imbalances in your portfolio exposures. Make sure you aren’t too concentrated in Mag 7 and U.S. growth stocks, and, if you don’t have international stock exposure, now is a great time to introduce some. International P/E’s are attractive/historically low, and we see fundamental catalysts surfacing that could drive improving earnings growth overseas.
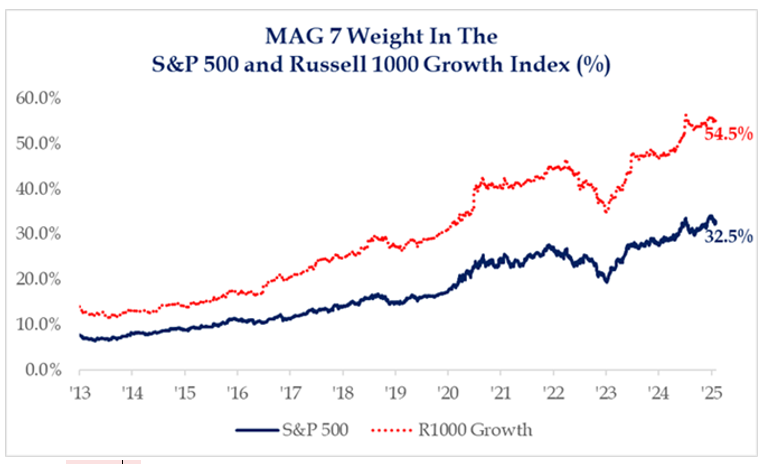
Source: Strategas, data as of 12/31/2024

Source: Factset for the time period 3/31/1995 through 3/31/2025. Percentages are the market cap of the constituent indexes for the S&P Gkibal 1200 and dividing them by the total market cap for the broad index. US is represented by the S&P 500, Europe by the S&P Europe 35, Japan by the S&P Topix 150, Rest of World (ROW) is the difference.
- Alternatives: Consider introducing strategies in the alternatives category that provide downside protection and low correlation to traditional stock-bond asset classes.
Wrap Up
2023 and 2024 were years to be very return focused as we recovered and surged out of the 2022 bear market. 2025 is a year to be more balanced and have equal focus on return and risk control. In thinking about this, I was inspired to dust off a core read for investors, Charlie Ellis’ book “Winning the Loser’s Game.” In it, Ellis says the key to successful investing is to avoid the large loss, especially in tough environments. Unlike professional tennis in which all the elite players are trying to hit the winner to close out the match, in investing during challenging environments, it’s best to focus on avoiding the unforced error. In the internal equity strategies, we are doing just that in this environment. We are trimming concentrations that started to build a bit in our extreme outperformers over the last two years, and we are introducing a little more defensive and countercyclical stock exposure, all the while maintaining reasonably sized positions in stocks with strong fundamentals that have sold off a bit. Now is the time for balance and diversification as much as ever. We’ll continue to experience market moving announcements such as the early April tariff news coming from Washington policymakers, so this tenet is vital at present. It won’t be the last policy announcement we hear this year, for sure!
Sources:
12345FactSet
6Strategas
7https://www.fiscal.treasury.gov/files/reports-statements/combined-statement/cs2024/receipt.pdf
8FactSet
9FactSet
10Bureau of Labor Statistics
This commentary is provided for informational and educational purposes only. As such, the information contained herein is not intended and should not be construed as individualized advice or recommendation of any kind.
The opinions and forward-looking statements expressed herein are not guarantees of any future performance and actual results or developments may differ materially from those projected. The information provided herein is believed to be reliable, but we do not guarantee accuracy, timeliness, or completeness. It is provided “as is” without any express or implied warranties.
Diversification is an investment strategy designed to help manage risk, but it does not ensure a profit or protect against loss in a declining market.
Equity securities are subject to price fluctuation and investments made in small and mid-cap companies generally involve a higher degree of risk and volatility than investments in large-cap companies. International securities are generally subject to increased risks, including currency fluctuations and social, economic, and political uncertainties, which could increase volatility. These risks are magnified in emerging markets.
Fixed-income securities are subject to loss of principal during periods of rising interest rates and are subject to various other risks including changes in credit quality, market valuations, liquidity, prepayments, early redemption, corporate events, tax ramifications, and other factors before investing. Interest rates and bond prices tend to move in opposite directions. When interest rates fall, bond prices typically rise, and conversely, when interest rates rise, bond prices typically fall.
There is no assurance that any investment, plan, or strategy will be successful. Investing involves risk, including the possible loss of principal. Past performance does not guarantee future results, and nothing herein should be interpreted as an indication of future performance. Please consult your financial professional before making any investment or financial decisions.
The S&P 500 is a capitalization-weighted index designed to measure the performance of the broad domestic economy through changes in the aggregate market value of 500 stocks representing all major industries. The Nasdaq Composite is a stock market index that includes almost all stocks listed on the Nasdaq stock exchange. The Russell 1000 Growth Index measures the performance of the large cap growth segment of the US equity universe. The MSCI EAFE Index is an equity index which captures large and mid cap representation across Developed Markets countries around the world, excluding the US and Canada. The MSCI Emerging Markets Index captures large and mid cap representation across 24 Emerging Markets (EM) countries. The indexes referenced herein are unmanaged and cannot be directly invested in.
Mag 7 stocks refer to Alphabet, Amazon, Apple, Meta, Microsoft, Nvidia and Tesla.
Investment advisory services are offered through Investment Adviser Representatives (“IARs”) registered with Mariner Independent Advisor Network (“MIAN”) or Mariner Platform Solutions (“MPS”), each an SEC registered investment adviser. These IARs generally have their own business entities with trade names, logos, and websites that they use in marketing the services they provide through the Firm. Such business entities are generally owned by one or more IARs of the Firm, not the Firm itself. For additional information about MIAN or MPS, including fees and services, please contact MIAN/MPS or refer to each entity’s Form ADV Part 2A, which is available on the Investment Adviser Public Disclosure website (www.adviserinfo.sec.gov). Registration of an investment adviser does not imply a certain level of skill or training.
Material prepared by MIAN and MPS.